Quick insights with Unique()
During a big client meeting, and my boss leans over and whispers: "If you can get the stats they just mentioned, we can win this contract. But COO has to run - if I stall, can you get the numbers in the next 30 seconds?"
Of course. There are three or four ways to get the numbers, but only one is fast enough to deliver: Unique(). When combined with Countif() or Sumif(), you have a simple, powerful. and analytical one-two punch.
We'll work from this example spreadsheet (make a copy and try the formulas yourself if you like!). In the example, let's say we're hypothetical managers of the sales team here. So what's the issue we're trying to solve as managers?
The Problem: who are the top performers on my team?
The Method, Part 1: using Unique() - Cleaning data and Who are our people?
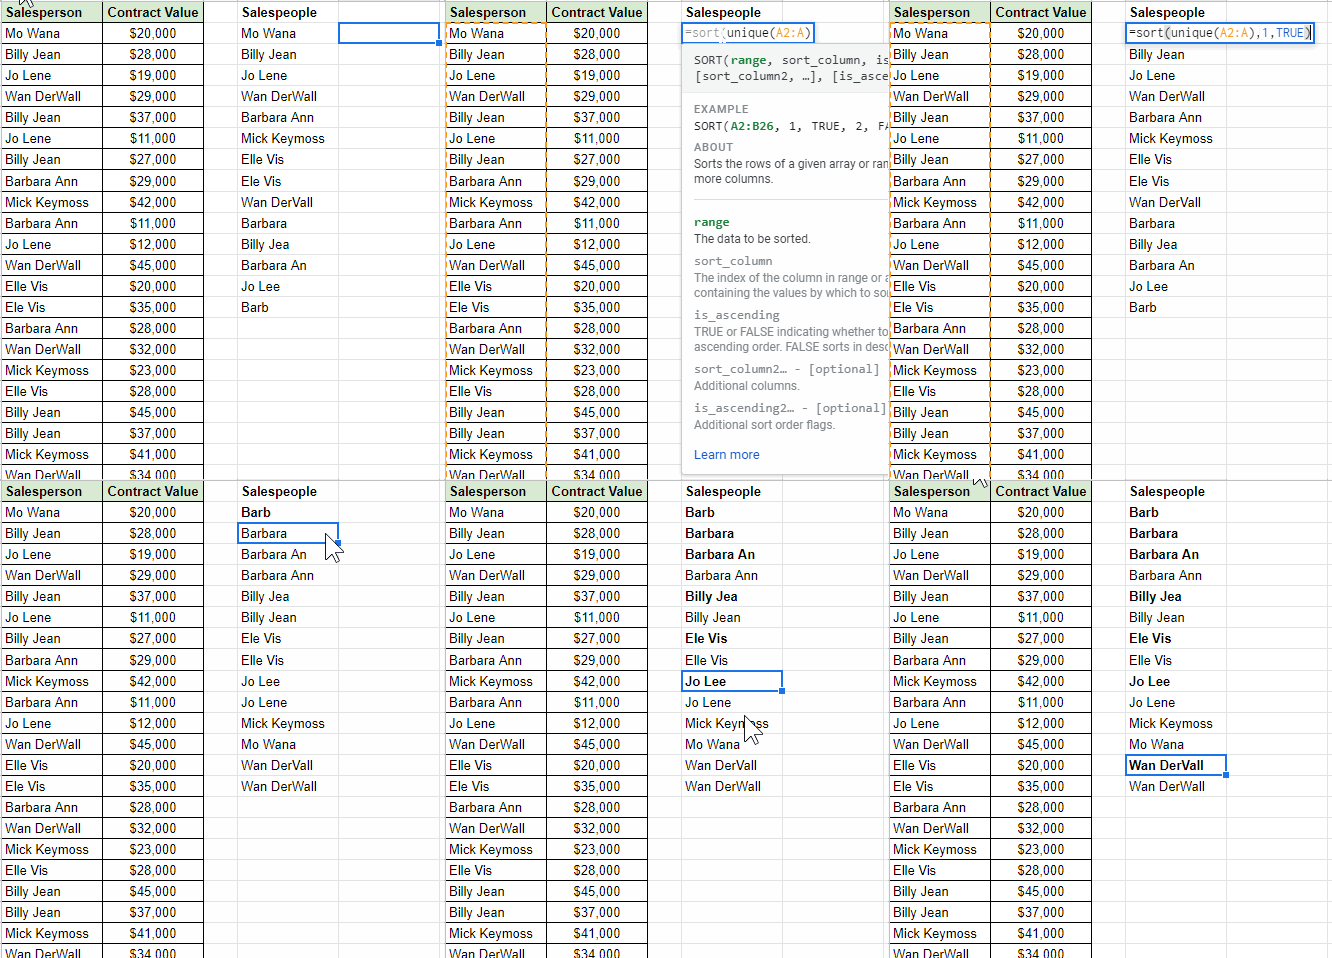
Unique() is easy to understand: give it a range, and it spits out all unique values (official definition and support page here). This formula, unique to Google Sheets, allows you to:
Combine duplicates into one condensed list
Find errors and start data cleaning
Oops, some names have been entered inconsistently, a few spelling or shortened names here and there. Let's add a Sort() around our Unique(), to list and compare alphabetically.
Definitely a few spelling issues here. I bolded the incorrect values in the example, and then just did a quick find+replace offscreen to fix the issue.
Great, now the data is clean. Two questions come to mind: how many contracts did each person get, and then how much money did each make the company? As each row represents a single contract, the first question is easy.
THE METHOD, PART 2: ADDING COUNTIF() - HOW MANY CONTRACTS DID EACH PERSON WIN?
Here's where the magic starts. Let's put into normal language what we want: a count of the number of times each name appears in the table.
Steps here:
Make a new column, "Count".
Create the formula: select Column A, then set the Count criteria to D2, the first name on our list. Make the Column A reference absolute, but leave the Salesperson reference as relative, so the formula automatically reference names in lower rows when dragged down.
Drag the formula down, and voila!
Excellent! We've already answered one important question: how many contracts did each salesperson have?
THE METHOD, PART 3: COMPARE WITH SUMIF() - WHO'S MADE THE MOST MONEY?
Finally, we get to see what salesperson makes the company the most money per contract. We only want to sum the contracts for each particular salesperson, so Sumif() will work nicely here. To use this formula, we have to set:
The range for the criteria (column A),
The criteria itself (D2, the salesperson), and
The range to add (Column B). Let's take a look:
And just like that, we quickly see that Barbara Ann is our top performer, and Elle Vis the next highest. But my past sales experience makes me twitch here - maybe those two made the most cash, but are they the most productive for their efforts? I want to look at one more comparison: the average value of each contract per person.
BONUS: FIND THE AVERAGE CONTRACT VALUE, AND HIGHLIGHT WITH CONDITIONAL FORMATTING.
The formula is straightforward - we just divide the Total by the number of Contracts per person, or F2 / E2 as one example.
Then, let's visually highlight see who's the highest and lowest - so I let Conditional Formatting do the work for me. This is found through the Format tab > Conditional Formatting > Color Scale.
Look at that! Now we can make informed management decisions with this data.
THE BUSINESS INSIGHT: BARBARA ANN HUSTLED WELL, AND BILLY JEAN ACTUALLY MADE A BIT MORE PER CONTRACT. MANAGEMENT SHOULD WORK TO UNDERSTAND EACH OF THEIR WORKFLOW AND OPTIMIZATION STRATEGIES, THEN BUILD ON STRENGTH BY APPLYING THESE INSIGHTS TO THE TEAM BEST PRACTICES. THIS GUIDANCE MIGHT ESPECIALLY HELP JO LENE, WHO SOLD THE SAME NUMBER OF CONTRACTS AS BILLY, BUT MADE ~$3,000 LESS EACH TIME.
Of course, there are other ways to do this, specifically with pivot tables or queries. I use both often, but they have a few issues. Pivot tables are a huge drain on memory, and even just a few often break a spreadsheet. Queries are wonderful, but are a little more in-depth than some people are ready for. I'll demonstrate in a later post! Quick recap:
Unique() finds unique values in a range.
Countif() gives you a count of those unique values in the range.
Sumif() uses those unique values as a criteria to compare them with values from another column.
Use your intuition to test for other insights!
That's exactly what I did in my meeting - and twenty seconds later, I leaned over to my boss with a smug "done", and stood up ready to win our contract.


